Third Quarter Highlights
- U.S. Treasury (UST) yields moved substantially lower during the quarter, particularly in shorter-dated maturities as fed funds rate-cut expectations increased. This led to a significant steepening in the yield curve, with the 2-10-year UST curve disinverting for the first time in more than two years.
- While broader economic data remained generally resilient, U.S. labor markets weakened. Notably, July labor market data, which showed sluggish payroll growth and a 0.2% monthly increase in the unemployment rate to 4.3%.
- Federal Reserve (Fed) messaging became more dovish throughout the quarter as concerns migrated from inflationary pressures to softening labor market conditions. This culminated with a 50-basis-point (bp) fed funds rate cut at the September Federal Open Market Committee (FOMC) meeting, bringing the target range to 4.75%-5.00%.
- The FOMC's September projections indicated an additional 50 bps of cuts over the balance of this year, along with 100 bps of cuts in 2025, and 50 bps in 2026.
- Investment grade corporate issuance continued at a robust pace during the quarter as companies capitalized on the dip in UST yields and low risk premiums.
- Credit spreads spiked higher in early August amid broad market volatility; however, the flight to quality was short-lived as spreads quickly retraced their move and ended lower quarter over quarter.
Duration Positioning
Neutral
Relatively neutral duration positioning given balanced yield and return symmetry.
Credit Sector
Neutral (based on contribution to duration)
Overweight Financials and select Industrial categories, namely within Energy-related sub-sectors. Underweight Healthcare, Capital Goods and Non-corporate Credit.
Structured Products
Overweight
Maintained overweight positions in Asset-backed Securities (ABS) across strategies. Allocations in Agency Mortgage-backed Securities (MBS) remain modestly overweight within both Aggregate and Non-aggregate styles.
3Q24: Progress isn't always a straight line
Given continued evidence that inflation is receding, attention pivoted to recent labor market softening. A surprisingly weak July jobs report, coupled with a brief, but forceful, selloff in equity markets, served as catalysts for a sizeable drop in UST yields in late July and early August. Chair Jerome Powell later emphasized the Fed's concerns about the labor market at its annual Jackson Hole Economic Symposium, setting the stage for potential monetary policy easing at the September FOMC meeting. Fixed income markets followed this dovish messaging by discounting an aggressive path for rate cuts over the next several quarters.
This series of events benefited fixed income investors as the Bloomberg U.S. Aggregate Index posted a total return of 5.20% for the quarter and an impressive 11.57% for the trailing 12-month period. Despite the mid-summer flight to quality, credit spreads compressed during the quarter, generating an excess return of 0.70%. Structured products also outperformed; the MBS and ABS sectors delivered excess returns of 0.78% and 0.15%, respectively (Figure 1). Notably, agency MBS outperformed Credit during the quarter as rate volatility moderated in September and the UST curve steepened. High Yield returns outpaced investment grade; however, much of that outperformance originated from the CCC-rated tier.
Figure 1. Sector Comparison
Excess returns were positive across sectors for the quarter
|
Option-Adjusted Spread (bps) |
Excess Returns % |
| Sector |
Current |
Change from Last Quarter |
3 Month |
YTD |
| U.S. Agency |
16 |
3 |
0.05 |
0.29 |
| U.S. Credit |
84 |
(4) |
0.70 |
1.53 |
| Industrials |
87 |
(3) |
0.60 |
1.19 |
| Utilities |
92 |
(12) |
1.50 |
2.29 |
| Financials |
90 |
(7) |
0.84 |
229 |
| Non-corporate Investment Grade |
54 |
1 |
0.26 |
0.74 |
| U.S. Mortgage-backed Securities |
42 |
(6) |
0.78 |
0.52 |
| Asset-backed Securities |
64 |
7 |
0.15 |
0.89 |
| CMBS: ERISA-eligible |
93 |
(4) |
0.36 |
2.15 |
| U.S. Corporate High Yield |
295 |
(14) |
1.72 |
3.80 |
As of 9/30/2024. Source: Bloomberg L.P.
A balancing act: Fed's dual mandate results in a policy pivot
While the FOMC's decision to cut the fed funds rate at the September meeting was well telegraphed, the 50-bp size was larger than some market prognosticators expected. Market pricing ahead of the meeting implied a larger cut, likely offering the Fed a window to “catch up” from soft labor data over the final months of the quarter. However, Chair Powell emphasized in his post-meeting press conference that 50-bp cuts should not be extrapolated into the future, and the pace of subsequent policy decisions would remain “data dependent.”
Updated Fed projections indicate an expectation for economic conditions to warrant a brisk pace of policy easing over the next several years. Members' inflation forecasts declined and are now closer to the Fed's long-term 2% target, but their projections for the unemployment rate increased, suggesting the balance of risk has shifted toward the labor market (Figure 2). Accordingly, projections for the fed funds rate dropped and now indicate an additional 50 bps of easing this year, 100 bps in 2025, and 50 bps in 2026. This would equate to a policy rate of 2.875% by the end of 2026, matching the longer-run “neutral” rate. Interestingly, the long-term neutral rate — largely an academic exercise — has drifted higher for a third straight quarter, which suggests the “real” policy rate may be above 1%. For much of the post-global-financial-crisis period, the real policy rate has been negative, so market participants will need to adapt to an environment in which the cost of capital is positive in inflation-adjusted terms.
Figure 2. Personal Consumption Expenditures (PCE) Price Index
The Fed has made substantial progress toward its 2% target
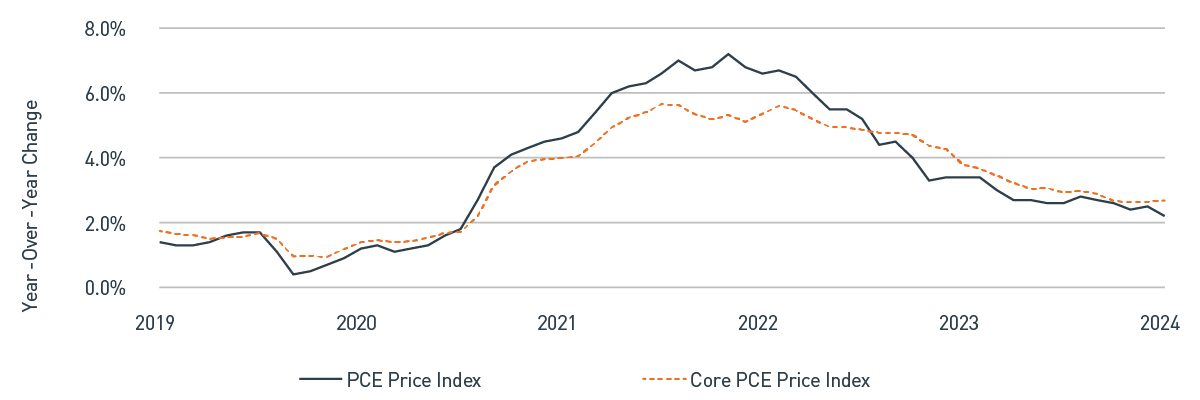
As of 9/30/2024. Source: Bloomberg L.P.
Recent economic data, particularly the strong September payroll report (released on October 4), has helped both calm fears over the labor market and realign the market's expectations for the path of monetary policy. The market has consistently mis-estimated the pace of policy change, as we discussed in our whitepaper, The Market's Great Expectations. As recently as September, the fed funds futures market indicated a high probability of another 75 bps of cuts this year and a cumulative 2% reduction in the policy rate by the end of 2025. This has since moderated to a more modest six cuts over that horizon.
Monetary policy remains tight relative to the current level of inflation; therefore, as the Fed assesses the balance of risks, we expect the FOMC to maintain an easing bias unless the data clearly paints a different picture. That said, near-term economic data is likely to remain choppy as we enter the “landing” phase of the regime, and the Fed tries to calibrate the policy rate to balance its dual mandate of stable prices and full employment.
Mind your Ps and Qs: “P”runing risk in favor of “Q”uality
We entered the third quarter with a defensive posture across strategies given our view that corporate credit valuations remain expensive. However, during the quarter, robust levels of new issuance and a brief bout of volatility in credit spreads allowed us to make tactical adjustments to client portfolios. Amid the early August sell-off, we prioritized adding higher-quality issuers within the Industrials and Financials sub-sectors through both primary and secondary markets. This window was short-lived; after spiking roughly 20 bps, credit spreads quickly retraced their move and were once again expensive by late August.
Toward the end of the quarter, we returned to risk-reduction mode by lowering our Credit exposures to the point where all strategies were generally neutral to their benchmark index from a contribution-to-duration perspective. Within Credit subsectors, we maintain a bias toward higher-quality Financials issuers because valuations remain somewhat attractive. However, we have seen Financials' relative valuation advantage versus Industrials compress and now consider the tradeoff between them to be more balanced.
A key tenet of our risk-focused process is our emphasis on the symmetry of potential return outcomes. While healthy fundamentals and favorable market technicals support fully valued risk premiums, the potential for meaningful future excess returns is limited, in our view. Within Industrials broadly, we believe opportunities are limited as credit spreads are quite expensive on a historical basis. At the time of this writing, the Bloomberg Aggregate Credit Index option-adjusted spread has compressed to 77 bps, matching the post-financial-crisis low in June 2021. History has shown that at current levels, forward-looking excess returns tend to be constrained to carry, at best.
We believe some of the late-stage spread compression reflects incremental demand for yield in an environment where peak rates are unlikely to be revisited this cycle, as inflation pressures have abated, and the Fed has begun to ease policy. Often, in these circumstances, investors tend to focus on all-in yield. As a result, moves higher in UST yields are correspondingly offset by tighter spreads, leaving yields relatively unchanged.
We continue to believe opportunities lie within Structured Products, where valuations remain compelling relative to Credit. Active ABS new-issue markets have allowed us to maintain allocations at the higher end of historical weights. Our sole focus remains AAA-rated structures supported by robust credit enhancements. From a valuation perspective, it has been common for spreads on ABS to be twice that of A-rated Industrial issuers and roughly equivalent to those of BBB-rated issuers with similar durations. Given the dearth of AAA-rated supply, we believe ABS allocations remain a favorable way to enhance yield as we wait for better entry points in riskier alternatives. Similarly, while MBS has performed well as of late, offsetting recent underperformance, valuations remain in line on a historical basis. Stable prepayments offer a favorable fundamental backdrop and moderate new supply provides a tailwind. We have maintained modest overweight positions across Aggregate styles and a slightly more pronounced overweight in Government/Credit strategies.
Market outlook: “Goldilocks” pricing in a highly uncertain environment
Despite the continued resiliency of the U.S. economy, there are an array of potential macro concerns on the horizon. We believe lengthy conflicts in Europe and the Middle East, China's languishing economy, resurging global protectionism and heightened election uncertainty, all provide potential near-term catalysts for volatility. Financial conditions have eased materially over the last year, enabling what we view as a degree of complacency across markets. When coupled with generally expensive risk premiums, these dynamics inform our more cautious outlook and defensive portfolio posture.
After migrating lower since early 2023, interest rate volatility has resurfaced, partially due to inconsistent economic data. Although inflation has undoubtedly slowed, we believe it's too soon to say the embers have fully cooled. The Fed is faced with the need to be mindful of its policy stance and the potential for pockets of inflationary cinders to reignite. Alternatively, the lagged effects of the Fed's former aggressive monetary policy tightening could quickly emerge and upend the chances for a soft landing. Neither of these scenarios are our base case; however, hints of either could sustain interest rate volatility at elevated levels.
Despite these uncertainties, we believe fixed income investors continue to benefit from a favorable yield environment — even with short and intermediate rates well below the peaks from a year ago. The income afforded in the current environment provides a valuable cushion against interest rate risk and continues to offer an attractive entry point, even for those investors who remain heavily allocated to cash.
Important Disclosures
Index definitions are available at https://www.pnccapitaladvisors.com/index-definitions/
This publication is for informational purposes only. Information contained herein is believed to be accurate, but has not been verified and cannot be guaranteed. Opinions represented are not intended as an offer or solicitation with respect to the purchase or sale of any security and are subject to change without notice. Statements in this material should not be considered investment advice or a forecast or guarantee of future results. To the extent specific securities are referenced herein, they have been selected on an objective basis to illustrate the views expressed in the commentary. Such references do not include all material information about such securities, including risks, and are not intended to be recommendations to take any action with respect to such securities. The securities identified do not represent all of the securities purchased, sold or recommended and it should not be assumed that any listed securities were or will prove to be profitable. Past performance is no guarantee of future results.
PNC Capital Advisors, LLC claims compliance with the Global Investment Performance Standards (GIPS®). A list of composite descriptions for PNC Capital Advisors, LLC and/or a presentation that complies with the GIPS® standards are available upon request.
PNC Capital Advisors, LLC is a wholly-owned subsidiary of PNC Bank N.A. and an indirect subsidiary of The PNC Financial Services Group, Inc. serving institutional clients. PNC Capital Advisors’ strategies and the investment risks and advisory fees associated with each strategy can be found within Part 2A of the firm’s Form ADV, which is available at https://pnccapitaladvisors.com.
©2024 The PNC Financial Services Group, Inc. All rights reserved.
FOR INSTITUTIONAL USE ONLY
INVESTMENTS: NOT FDIC INSURED-NO BANK GUARANTEE – MAY LOSE VALUE