As we near the end of the Fed’s interest rate hiking regime, it’s last call for cash.
The Federal Reserve’s (Fed’s) aggressive response to sky-high inflation over the past 18 months has catapulted the shortest end of the yield curve to its highest levels in more than 15 years, giving cash the appearance of a worthwhile investment option. With evidence of progress in the battle against inflation, we believe the Fed is approaching the terminal rate for this cycle. As the Fed likely pauses to evaluate the “long and variable lag” effects of monetary policy on the economy, liquidity investors should actively consider how to adapt their investment programs.
Using our framework that distinguishes investment solutions based on operating, reserve and strategic cash considerations, we seek to help clients balance their liquidity needs and objectives with appropriate return and volatility expectations. At this point in the cycle, we believe it is an opportune time to consider the symmetry of expected return for more permanent liquidity portfolios.
The concept of symmetry considers the relationship between risk and the potential compensation for that risk. Is it balanced, or is it skewed in one direction? Being on the wrong side of an asymmetrical return-risk relationship usually leads to an undesirable outcome.
In U.S. fixed income, return symmetry has improved dramatically since 2022’s bond market reckoning, which we first highlighted in January. With the Fed previously having anchored the policy rate near zero, yields on broad market benchmarks were below 2%, compared to around 5% or more, recently. In addition, spreads on risk assets were significantly narrower as investors, starved for yield, bid up valuations to unsustainable levels. Given the still-inverted yield curve, we believe return symmetry appears most attractive in the short- to intermediate-duration areas of the market given the dynamics of interest rate risk.
Figure 1 depicts a hypothetical return distribution of the 1-year U.S. Treasury bill and several short/intermediate duration components of the Bloomberg U.S. Aggregate Bond Index over a three-month investment horizon, assuming a +/-50 basis point change in interest rates. With yields across these short/intermediate benchmarks around 5% or higher, we believe there is an opportunity for strategic liquidity portfolios to extend maturity profiles as the income accrual provides stronger downside protection.
Figure 1. Comparison of Potential Returns (%)
Short/intermediate indices have more favorable ratios of upside to downside
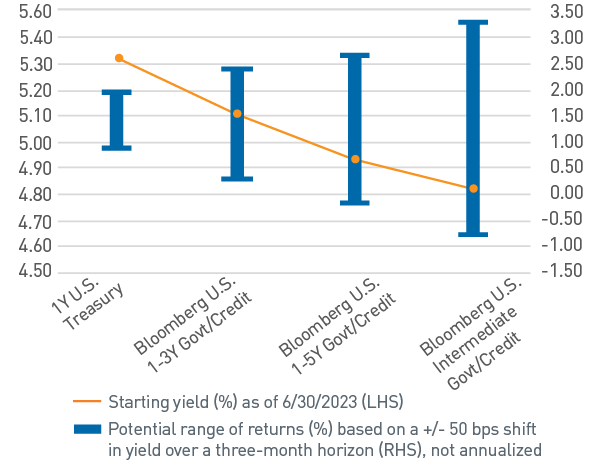
As of 6/30/2023. Source: Bloomberg L.P.
Another way to consider the relationship between yield and return is to look at historical performance. As shown in Figure 2, for the Bloomberg Intermediate Aggregate Index, a starting yield between 4%-6% has historically produced an average annual return of 5.4% over the following five-year period. The average return incorporates not just the yield or accrual, but also changes in portfolio market value associated with changes in interest rates. Higher starting yields should provide better downside protection in the event rates continue to rise, while longer maturity profiles increase the opportunity for total return should rates move lower.
Figure 2. Bloomberg Intermediate Aggregate Bond Index, 5-Year Forward Average Annualized Returns by Starting Yield Range (Jan. 1976 - Jun. 2023)
History portends well for current yield levels
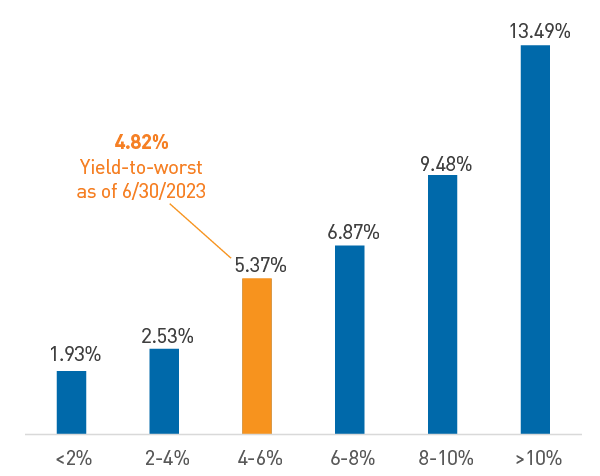
As of 6/30/2023. Source: Bloomberg L.P.
Importantly, expanding the liquidity conversation to longer-maturity solutions enhances opportunities for diversification by broadening the investable universe. Amid the current market backdrop, we continue to favor Structured Products, such as mortgage-backed and asset-backed securities, given improving valuations and solid fundamentals as the sector recovers from the overhang of banking industry stress earlier in the year. Within the high-quality areas of the sector in which we focus, we believe there are compelling alternatives to corporate credit for incremental yield and strong risk-adjusted returns. Overall, the short/intermediate portions of the curve offer enhanced spread relative to investment portfolios that more closely resemble traditional money market funds. (Figure 3).
Figure 3. Sector Credit Spread Comparison
Short/intermediate portions of the curve offer enhanced spread
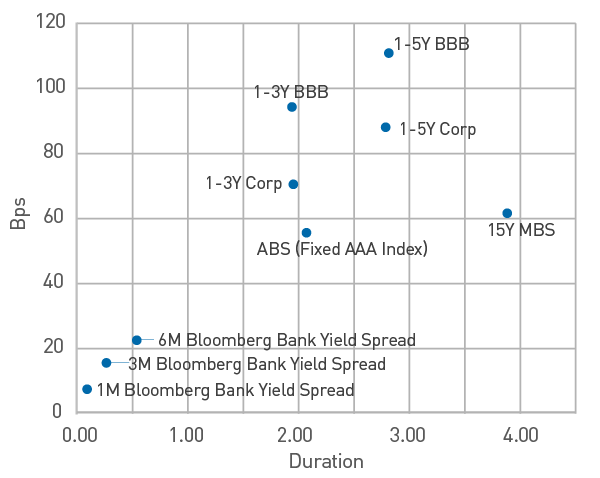
As of 6/30/2023. Source: Bloomberg L.P.
Return-risk considerations aside, it is important for liquidity investors to understand the context of the market landscape. The fed funds futures market is currently implying a terminal rate around 5.5%, which is consistent with the updated median Fed projection from the June Federal Open Market Committee meeting (Figure 4). While better aligned, the Fed’s stance remains that rates will stay higher for longer to ensure inflation — and inflation expectations — make material progress toward its 2% long-term objective.
Figure 4. U.S. Market-Implied Terminal Fed Funds Rate (%)
Markets and the Fed are coalescing around a similar terminal rate
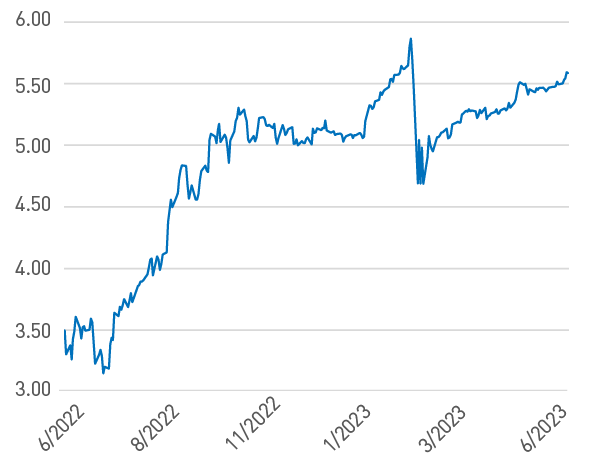
As of 6/30/2023. Source: The Daily Shot ®
In more challenging market environments, our focus remains on preserving capital. As we consider investment opportunities in the second half of 2023, we believe liquidity investors are being offered a compelling value proposition by extending their portfolio maturity profile. By doing so, we believe investors can potentially earn higher returns and broaden sector diversification with improved risk symmetry as market rates have risen significantly.