“Take nothing on its looks; take everything on evidence. There's no better rule.” — Charles Dickens, Great Expectations
Financial markets have been impatiently awaiting the Federal Reserve’s (Fed’s) next move since its last interest rate hike over a year ago. While the markets’ hopes for rate cuts were dashed repeatedly over the last 12 months, it appears “the time has come” for the Fed to embrace policy easing. Bond investors would be wise to heed the call of coming yield curve normalization.
After having suffered a vicious one-two punch of volatility in early August, markets appear to be back on their front foot. First, on July 31, the Bank of Japan announced a new round of policy tightening, in a continued decoupling of policy actions among major central banks. This move catalyzed a rapid unwind of leveraged yen carry trades, pressuring an already strained market. Two days later, a weaker-than-expected July U.S. nonfarm payrolls report prompted worries that the Fed had overshot its target and U.S. economic growth was on course to slow too rapidly, potentially leading to recession. Skittish investors were quick to react; on August 5, the 2-year U.S. Treasury (UST) note yield briefly touched 3.7%, while the CBOE Volatility Index spiked above 60, indicating considerable market stress.
Then, over the ensuing days, howling for an emergency rate cut by the Federal Open Market Committee (FOMC) abated and the market’s sudden consternation evaporated almost as quickly as it materialized. Risk assets have since recovered, as credit spreads in both investment grade and high yield are virtually unchanged, while the S&P 500® is almost 2% higher (Figure 1). However, this recent bout of extreme volatility made one enduring impact: both spot and forward U.S. interest rates have materially evolved. The inversion of the UST yield curve between 2 and 10 years has narrowed to around 12 basis points (bps), while the forward curve is pricing in an aggressive policy adjustment by the Fed over the next 12 months. Although the odds of a 50 bps cut in September have diminished, fed funds futures are priced for four cuts by the end of 2024 and almost eight cuts by mid-2025. Once again, market expectations for Fed policy have deviated considerably from both the most recent dot plot and guidance from Chair Jerome Powell following the July 31 FOMC meeting.
Figure 1. Comparison of Recent Market Data
The market’s sudden consternation evaporated almost as quickly as it materialized
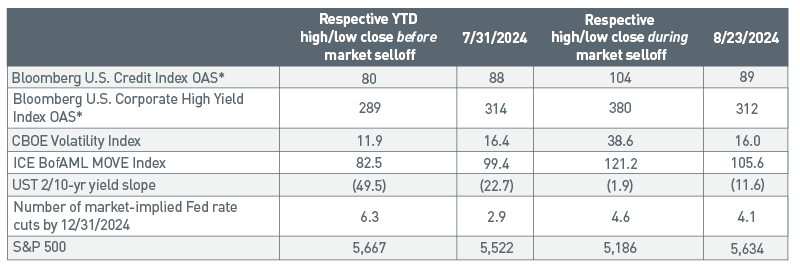
*Option-adjusted spread, measured in basis points. As of 8/23/2024. Source: Bloomberg L.P.
Has Sahm-thing Changed?
Given the long and variable lags of monetary policy, eventual economic softening has been expected — so why were markets so spooked by the August 2 jobs report? Notably, the 3-month change in the headline unemployment rate of 0.5% to 4.3% triggered what is known as the “Sahm rule,” thought to be a harbinger of recession (Figure 2). The indicator suggests a recession has begun when the 3-month average unemployment rate increases by 0.5% or more from its 12-month low.
Figure 2. Real-time Sahm Rule Recession Indicator
The August 2 jobs report triggered the Sahm rule
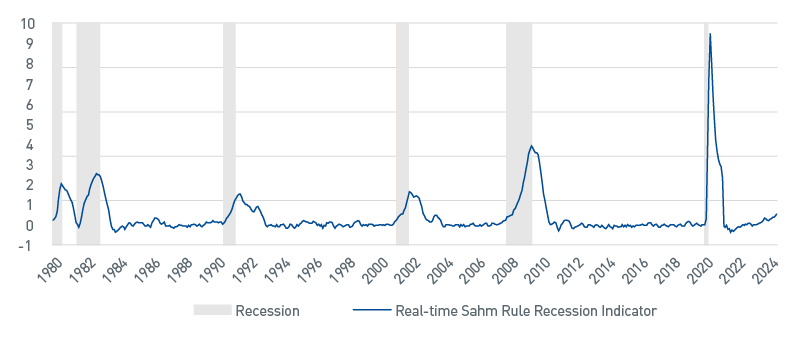
As of 7/31/2024. Source: Bloomberg L.P.
While past cycles may not repeat but often rhyme, it is worth pointing out that both the Conference Board Leading Economic Indicator Index and the inverted UST yield curve have been signaling a recession for well over a year. It is clear labor markets have cooled given trends in both the Job Openings and Labor Turnover Survey and nonfarm payroll report. In fact, labor markets were an area of emphasis for Chair Powell’s Jackson Hole Economic Symposium speech, during which he gave the clearest indication yet that rate cuts are on the horizon.
At best, economic indicators are sending mixed signals about the rate of slowing in U.S. economic growth. Like the Fed, our path forward continues to be data dependent as we believe the arguments are well balanced: at more than 2.5%, the real policy rate is restrictive (one of the highest in over 15 years) and should act to slow growth, but the dynamism of the U.S. economy should not be discounted. Continued progress on inflation is tantamount to the Fed gaining more confidence in aggressive policy easing. Although there is now a clearer line of sight to the Fed’s 2% inflation target, it is far from assured.
A Call to Action: All Aboard, not All Clear
Regular bouts of episodic volatility may continue for the foreseeable future as markets adjust to the withdrawals of extraordinary stimulus measures along with a coordinated tightening of the primary policy rate. Global central banks, in our view, have had a thumb on the scale since the global financial crisis. While the path of policy — and ultimately yields — remains largely uncertain, we believe the market has shifted into a paradigm of lower highs and lower lows. Even with the level of rates down significantly from the peak in late April, we continue to find the symmetry of yields further out the curve compelling (Figure 3). As such, we believe clients still have an opportunity to shift the duration posture of their portfolios to improve overall diversification and lock in higher yields. While the ship has not yet sailed, we’ve cast off the lines and call “All Aboard!” as the time has come for a Fed pivot.
Figure 3. Comparison of Potential Returns
Short/intermediate indices have more favorable ratios of upside to downside
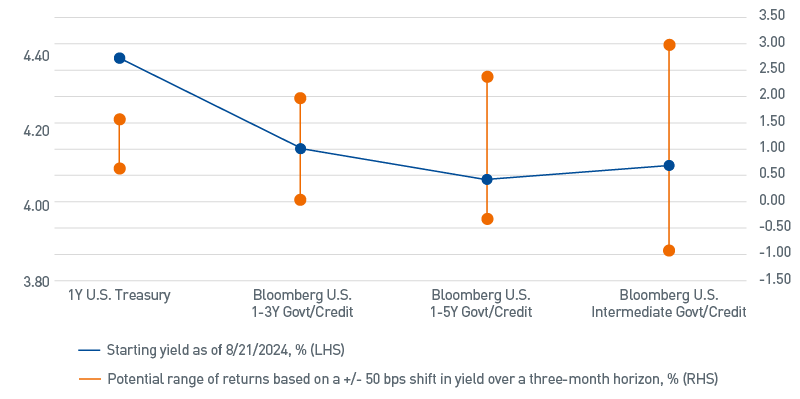
As of 8/21/2024. Source: Bloomberg L.P., PNC Capital Advisors
Important Disclosures
BLOOMBERG® is a trademark and service mark of Bloomberg Finance L.P. and its affiliates (collectively “Bloomberg”). Bloomberg or Bloomberg’s licensors own all proprietary rights in the Bloomberg Indices. Bloomberg does not approve or endorse this material, or guarantees the accuracy or completeness of any information herein, or makes any warranty, express or implied, as to the results to be obtained therefrom and, to the maximum extent allowed by law, neither shall have any liability or responsibility for injury or damages arising in connection there with.
This publication is for informational purposes only. Information contained herein is believed to be accurate, but has not been verified and cannot be guaranteed. Opinions represented are not intended as an offer or solicitation with respect to the purchase or sale of any security and are subject to change without notice. Statements in this material should not be considered investment advice or a forecast or guarantee of future results. To the extent specific securities are referenced herein, they have been selected on an objective basis to illustrate the views expressed in the commentary. Such references do not include all material information about such securities, including risks, and are not intended to be recommendations to take any action with respect to such securities. The securities identified do not represent all of the securities purchased, sold or recommended and it should not be assumed that any listed securities were or will prove to be profitable. Past performance is no guarantee of future results.
PNC Capital Advisors, LLC claims compliance with the Global Investment Performance Standards (GIPS®). A list of composite descriptions for PNC Capital Advisors, LLC and/or a presentation that complies with the GIPS® standards are available upon request.
PNC Capital Advisors, LLC is a wholly-owned subsidiary of PNC Bank N.A. and an indirect subsidiary of The PNC Financial Services Group, Inc. serving institutional clients. PNC Capital Advisors’ strategies and the investment risks and advisory fees associated with each strategy can be found within Part 2A of the firm’s Form ADV, which is available at https://pnccapitaladvisors.com.
Index definitions are available at https://pnccapitaladvisors.com/index-definitions
©2024 The PNC Financial Services Group, Inc. All rights reserved.
FOR INSTITUTIONAL USE ONLY
INVESTMENTS: NOT FDIC INSURED-NO BANK GUARANTEE – MAY LOSE VALUE